(Presentations were created using Wealthy and Wise®.)


One of the problems with most retirement plans today is they address only two of the three key issues.
The two that are typically addressed are:
- Pre-retirement asset allocation.
- Post-retirement asset allocation.
The one usually not addressed is:
- The order in which assets are accessed for retirement cash flow that produces the best long-range net worth and wealth to heirs.
Why is #3 overlooked? It’s simple — until now, no one has had the algorithm for this very complex calculation.
Example:
Simon and Ann Scott, age 55 and 50, plan to retire in ten years.
They currently have $6.5 million in liquid assets set aside to support their after tax, retirement cash flow requirements of $25,000/month indexed at 3.00% as an inflation offset.
These assets include just five different allocations, each earning a different yield and each subject to different taxation.
They are very concerned about prioritizing the order of accessing those assets for cash flow in order to maximize their long-range net worth and wealth to heirs.
Let’s assume we run an analysis to their ages 95/90. That’s 40 years with five different asset allocations with each of the required 4,800 calculations generating the desired yearly cash flow. If we run a factorial solve, we can test all the different prioritizations possible with these five allocations.
A factorial solve with five asset allocations with 40 year-by-year separate calculations requires:
1 x 2 x 3 x 4 x 5 = 120 x each year for 40 years =
4,800 comprehensive calculations
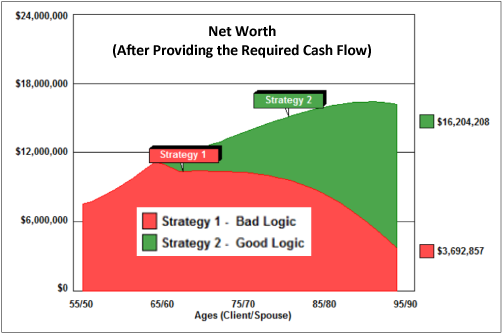
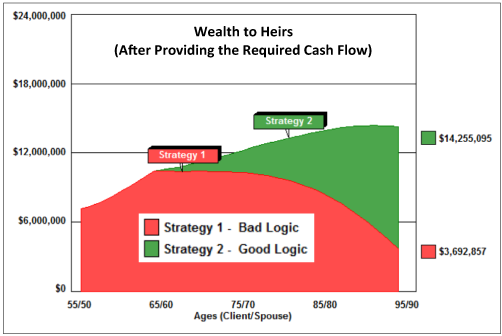
in order to determine the prioritization that ends up with the worst results:
(Strategy 1 - Bad Logic)
and the one that produces the best:
(Strategy 2 - Good Logic).
Note: With six asset allocations, it’s 28,800 calculations; with seven, it’s 201,600, with ten, it’s 145,152,000, etc. (Don’t try any of these with Excel.)
Does the order of accessing assets really make that much of a difference? You bet it does! InsMark’s Wealthy and Wise® software has the algorithm to perform the calculations for Simon and Ann in about two seconds.
Below are their results. (You do not want another adviser showing this logic to your clients who could then ask you, “Do you know about this? How come you didn’t show it to me?”)
Click here for an 8-minute video for details on how this strategy works within Wealthy and Wise®. (On the video, click on this icon ![]() for maximum screen resolution.)
for maximum screen resolution.)
Click here to learn more about InsMark’s Wealthy and Wise®. You can also contact Julie Nayeri at julien@insmark.com or 888-InsMark (467-6275). Institutional inquiries should be directed to David Grant, Senior Vice President – Sales, at dag@insmark.com or 925-543-0513.
InsMark’s Digital Workbook Files
If you would like some help creating customized versions of the presentations in this Blog for your clients, watch the video below on how to download and use InsMark’s Digital Workbook Files.
Digital Workbook Files For This Blog
Download all workbook files for all blogs
|
Note: If you are viewing this on a cell phone or tablet, the downloaded Workbook file won’t launch in your InsMark System. Please forward the Workbook where you can launch it on your PC where your InsMark System(s) are installed. |
InsMark’s Referral Resources
(Put our Illustration Experts to Work for Your Practice)
We created Referral Resources to deliver a “do-it-for-me” illustration service in a way that makes sense for your practice. You can utilize your choice of insurance company, there is no commission split, and you don’t have to change any current relationships. They are very familiar with running InsMark software.
Please mention my name when you talk to a Referral Resource as they have promised to take special care of my readers. My only request is this: if a Referral Resource helps you get the sale, place at least that case through them; otherwise, you will be taking unfair advantage of their generous offer to InsMark licensees.
Save time and get results with any InsMark illustration. Contact:
- Ben Nevejans, President of LifePro Financial Services in San Diego, CA.
![]()
More Recent Articles:
Blog #33: Referred Leads – How to Use Them Effectively
Blog #32: Documents On A Disk™ is Now in the Cloud
Blog #31: IRA Rescue Made Easy
Blog #30: Six Sales Ideas For Life Insurance Producers
(Steve Savant Interviews Bob Ritter)
Blog #28: Notes to Those Beginning to Sell Financial Products
| 3 Reasons Why It’s Profitable For You To Share These |
| Blog Posts With Your Business Associates and |
| Professional Study Groups (i.e. “LinkedIn”) |
Robert B. Ritter, Jr. Blog Archive
Hi Bob,
Another Social Security related question. Would it be possible after running a Social Security maximization algorithm to use the output as a basis from which to run a Wealthy & Wise presentation? Under the scenarios presented with W&W, would an analysis with maximized lifetime Social Security benefits enhance overall random asset distribution, optimally distributed assets and assets distributed optimally with gifting be superior than not doing so at all? Basically although SS benefits are more irrelevant to wealthier clients they should maximize SS benefits to essentially take pressure off other assets and their distribution.
Thanks
Sammy
Hi Sammy,
The only way to tell for sure for a specific client is to do one Wealthy and Wise Scenario with normal Social Security benefits and a second Scenario with maximized lifetime Social Security benefits, Be sure both Scenarios take into account all assets/benefits. Other than the difference in Social Security benefits, the two Scenarios should be identical. The easiest way to do this is to copy Scenario 1 into Scenario 2 and then change the Social Security data in Scenario 2. Then compare both Scenarios in the Comparison section. Whether gifting is involved or not, this should provide you with the information you want.
Problem: An early death will foul up the actual results because during the early phase of the analysis in retirement years, assets will be accessed more than if a Social Security benefit was present to help with the cash flow.
Thanks for taking the time to comment.
Bob Ritter
InsMark President
Does Wealthy & Wise include an analysis of when it is the optimal time to file for Social Security benefits? Would it show when it is optimal for high net worth clients to claim the benefits at 62 and invest in an indexed cash value life insurance or is it better to file for the benefits later on, say age 70, and reap the growth in the Social Security benefit?
Sammy
Hi Sammy,
That’s an interesting question. When first analyzing it, I compared your two scenarios in Wealthy and Wise: #1) taking Social Security at age 62 and #2) taking it at age 70. In both cases, I used the Social Security Calculator available in the Expected Assets tab on any of the drop down selections. This told me the after tax income from Social Security at age 62 was $14,950 for a fully qualified individual; at age 70, it was $26,910. I assumed both Social Security benefits would have a cost of living adjustment of 3.00% each year. I next invested those values in an Equity Account: 6.00% growth; 1.50% dividend, 70% long-term gains, 30% short-term gains, and 30% turnover. Waiting until age 70 came out ahead by the end of year 21 (age 82) and rapidly grew well ahead: $4,115,725 vs. 3,217,273 by age 100.
I was unable to schedule the increasing after tax Social Security income at age 62 into Indexed UL as you asked as my illustration software does not allow me to schedule varied payments for that length of time although I expect the favorable tax treatment of IUL may well have caused it to be the winner. That data could easily be imported into Wealthy and Wise and compared to the results of taking the income at age 70.
Thanks for taking the time to comment.
Bob Ritter
InsMark President